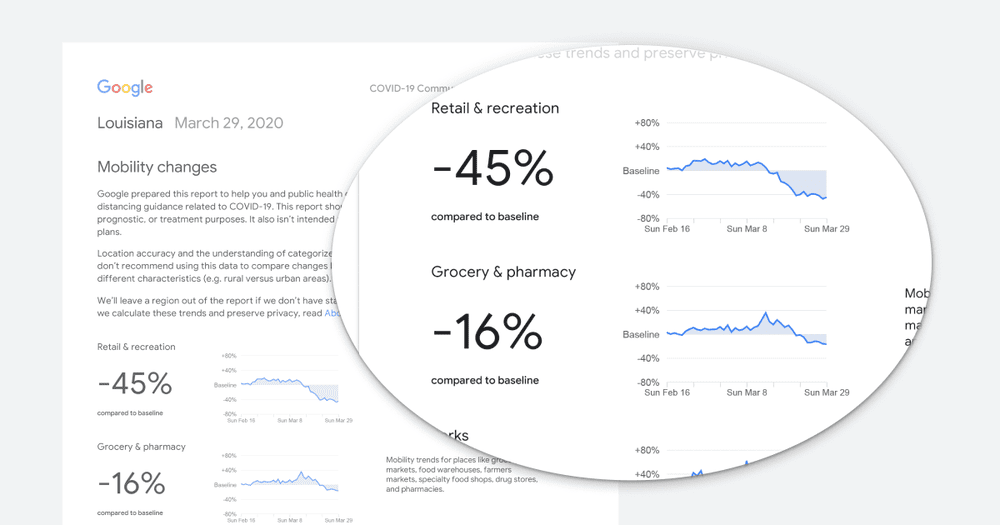
Google Maps today published an early release of the company’s COVID-19 Community Mobility Reports to provide insights for public health officials into what has changed in response to work from home, shelter in place, and other policies aimed at flattening the curve of the COVID-19 pandemic.
The reports use aggregated, anonymized data to chart movement trends over time by geography, across different high-level categories of places such as retail and recreation, groceries and pharmacies, parks, transit stations, workplaces, and residential. The reports display a percentage point increase or decrease in visits, not an absolute number of visits.
Google intends to release these reports globally, initially covering 131 countries and regions. “Given the urgent need for this information, where possible we will also provide insights at the regional level. In the coming weeks, we will work to add additional countries and regions to ensure these reports remain helpful to public health officials across the globe looking to protect people from the spread of COVID-19,” noted company officials in a statement.
In addition to the Community Mobility Reports, the company is collaborating with select epidemiologists working on COVID-19 with updates to an existing aggregate, anonymized dataset that can be used to better understand and forecast the pandemic. Data of this type has helped researchers look into predicting epidemics, plan urban and transit infrastructure, and understand people’s mobility and responses to conflict and natural disasters.


